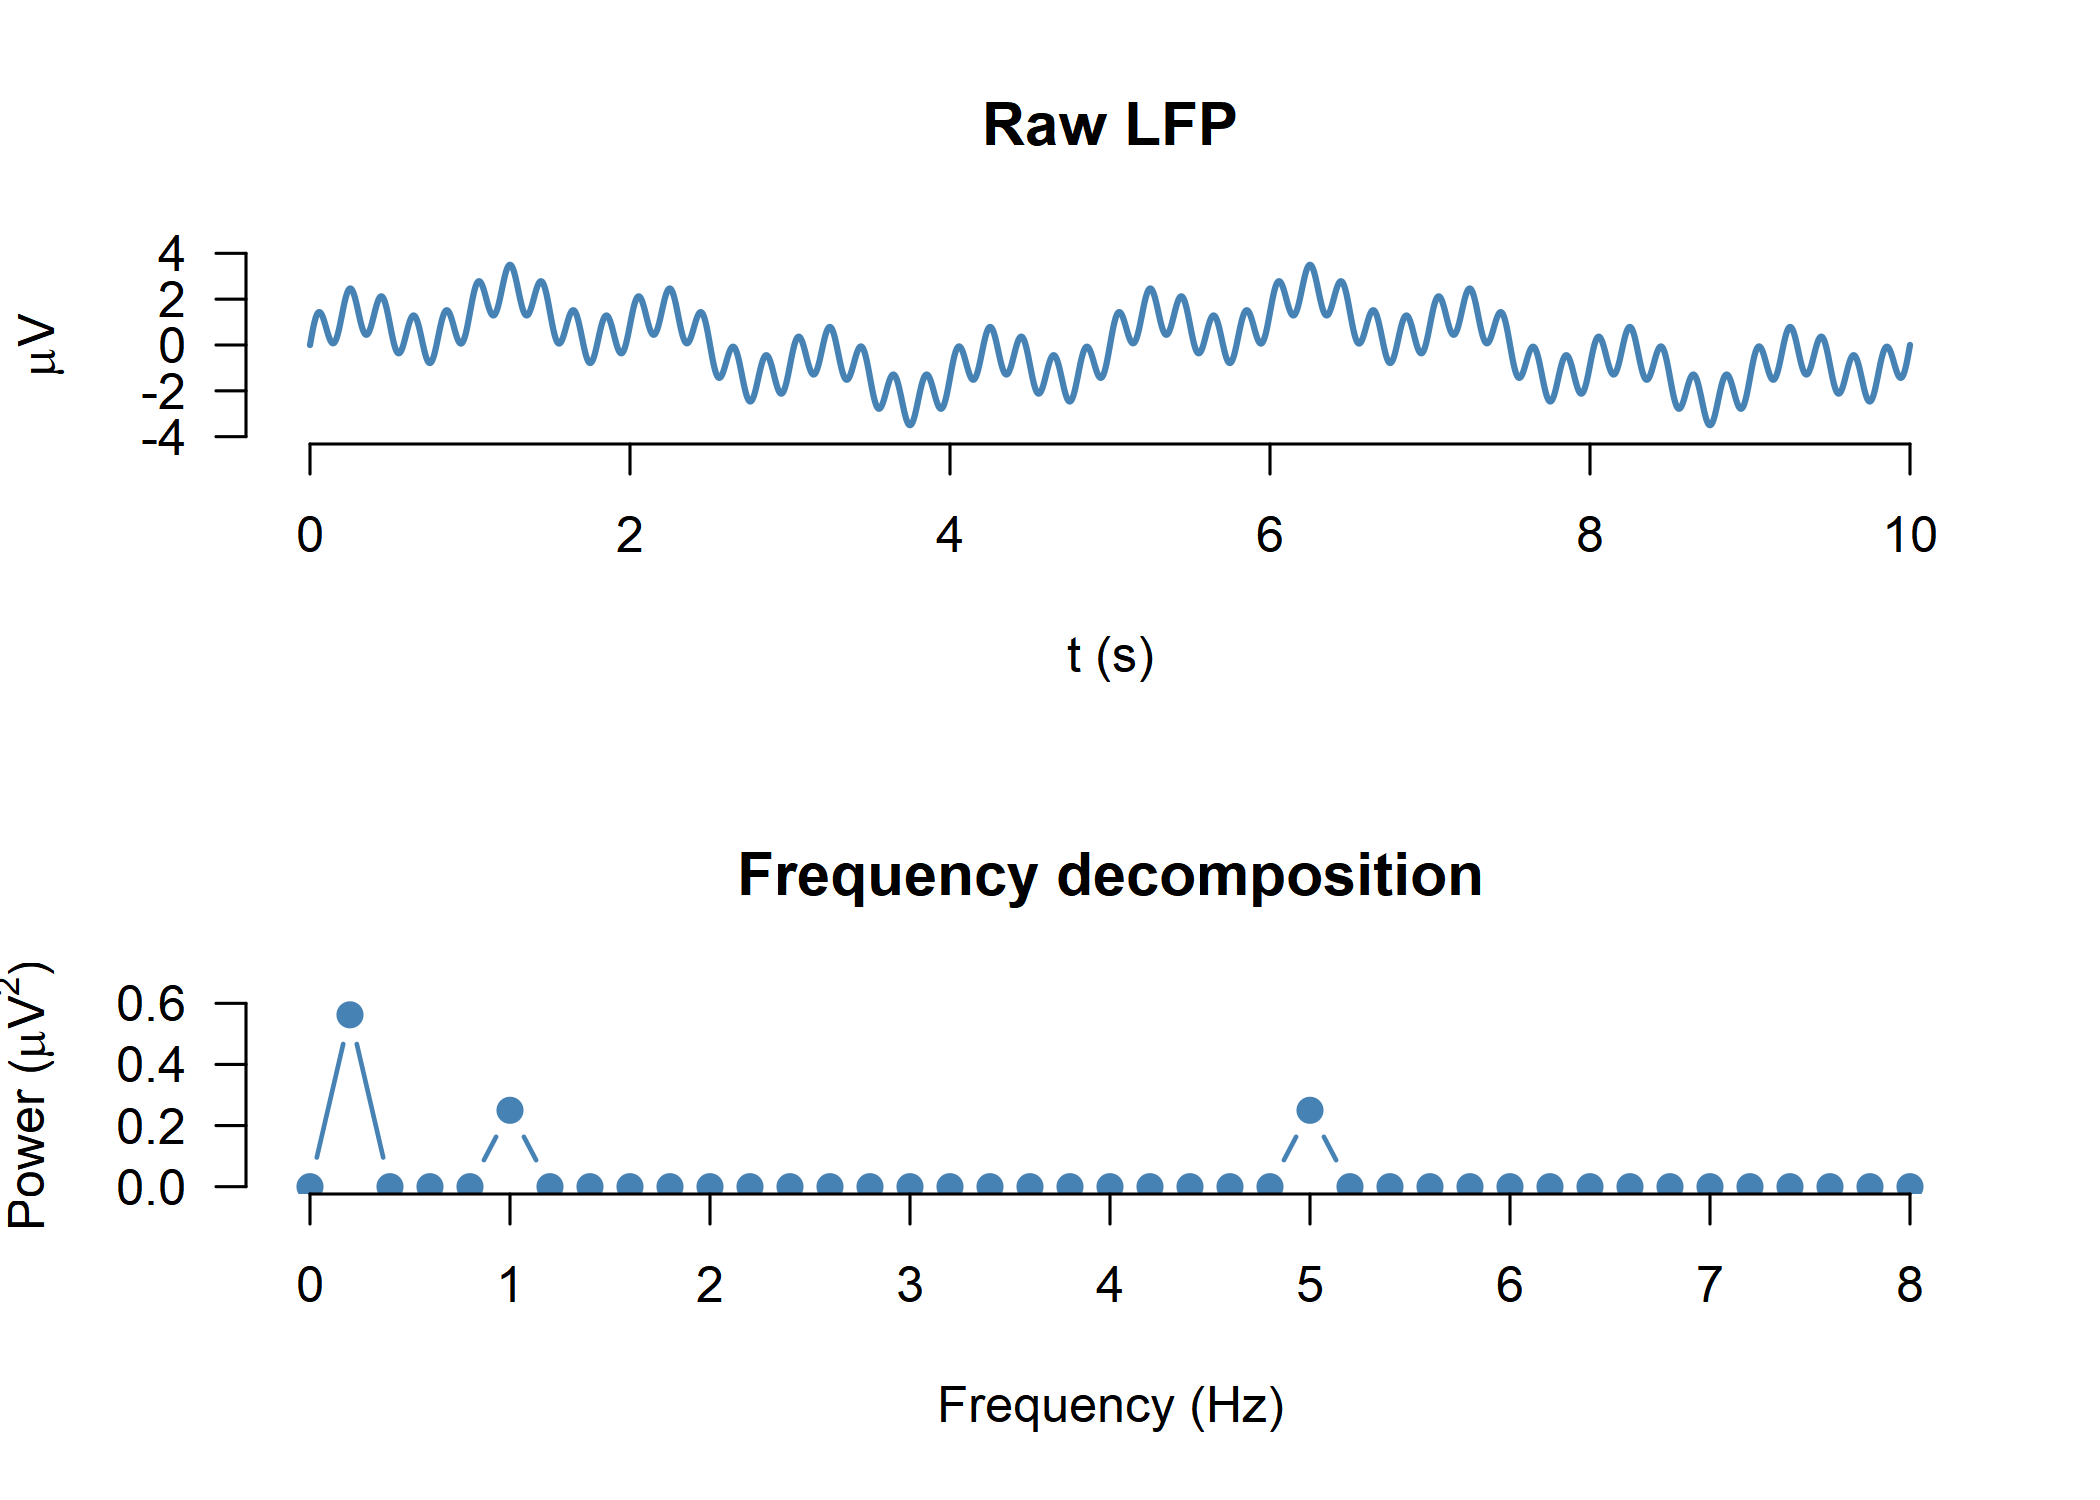
lfp <- sin(2*pi*5*t) + sin(2*pi*1*t) + 1.5*sin(2*pi*.2*t) #generating a signal with 1, 5, and 0.2 Hz

par(mfrow = c(2,1))

plot(t, lfp, type = "l", lwd = 2, col = "steelblue", bty = "n",
     xlab = "t (s)", ylab = expression(paste(mu, "V")),
     main = "Raw LFP", ylim = c(-4,4), las = 1)


df <- .2 #our desired frequency resolution
freq_vec <- seq(0,8,df)

meanZ <- NULL

for (i in 1:length(freq_vec)) {

  z = 1*exp(-2*pi*freq_vec[i]*t*1i) #kernel de Fourier

  Z = lfp*z

  meanZ[i] = mean(Z)

}

psd <- abs(meanZ)^2

plot(freq_vec,psd, type = "b", lwd = 1.5, cex = 1.5, col = "steelblue", pch = 20,
     xlab = "Frequency (Hz)",
     ylab = expression(paste("Power (", mu, V^2, ")")),
     main = "Frequency decomposition",
     bty = "n", xaxt = "n", ylim = c(0,.6), yaxt = "n")
axis(1, at = seq(0,8,1))
axis(2, at = seq(0,.6,.2), las = 1)